One alert, annotated line by line

A worked example of the format, with the arithmetic behind it.

Worked example

The chart, the levels, and the message itself

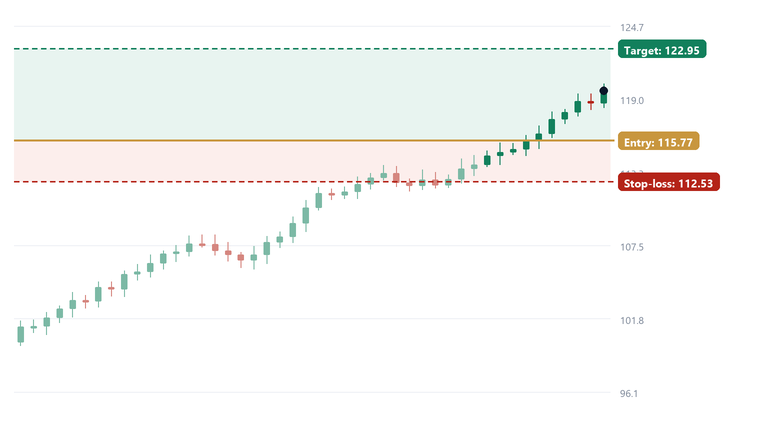
This is the format you'd receive it in, with an illustrative chart behind it. The numbers are invented to show the structure — they are not a past recommendation and not a record of performance.

Illustrative chart with target 122.95, entry 115.77 and stop-loss 112.53 marked
Sample only. Ticker, prices and levels are illustrative.
Morning listSample · 7:31am
1CBA$168.20
Entry166.50
Target174.00
Stop163.40
2BHP$42.10
Entry41.60
Target44.20
Stop40.60
3CSL$281.40
Entry278.00
Target292.00
Stop273.50

General information only — not personal financial advice.

Where the levels come from

Drawn on paper first. Typed second.

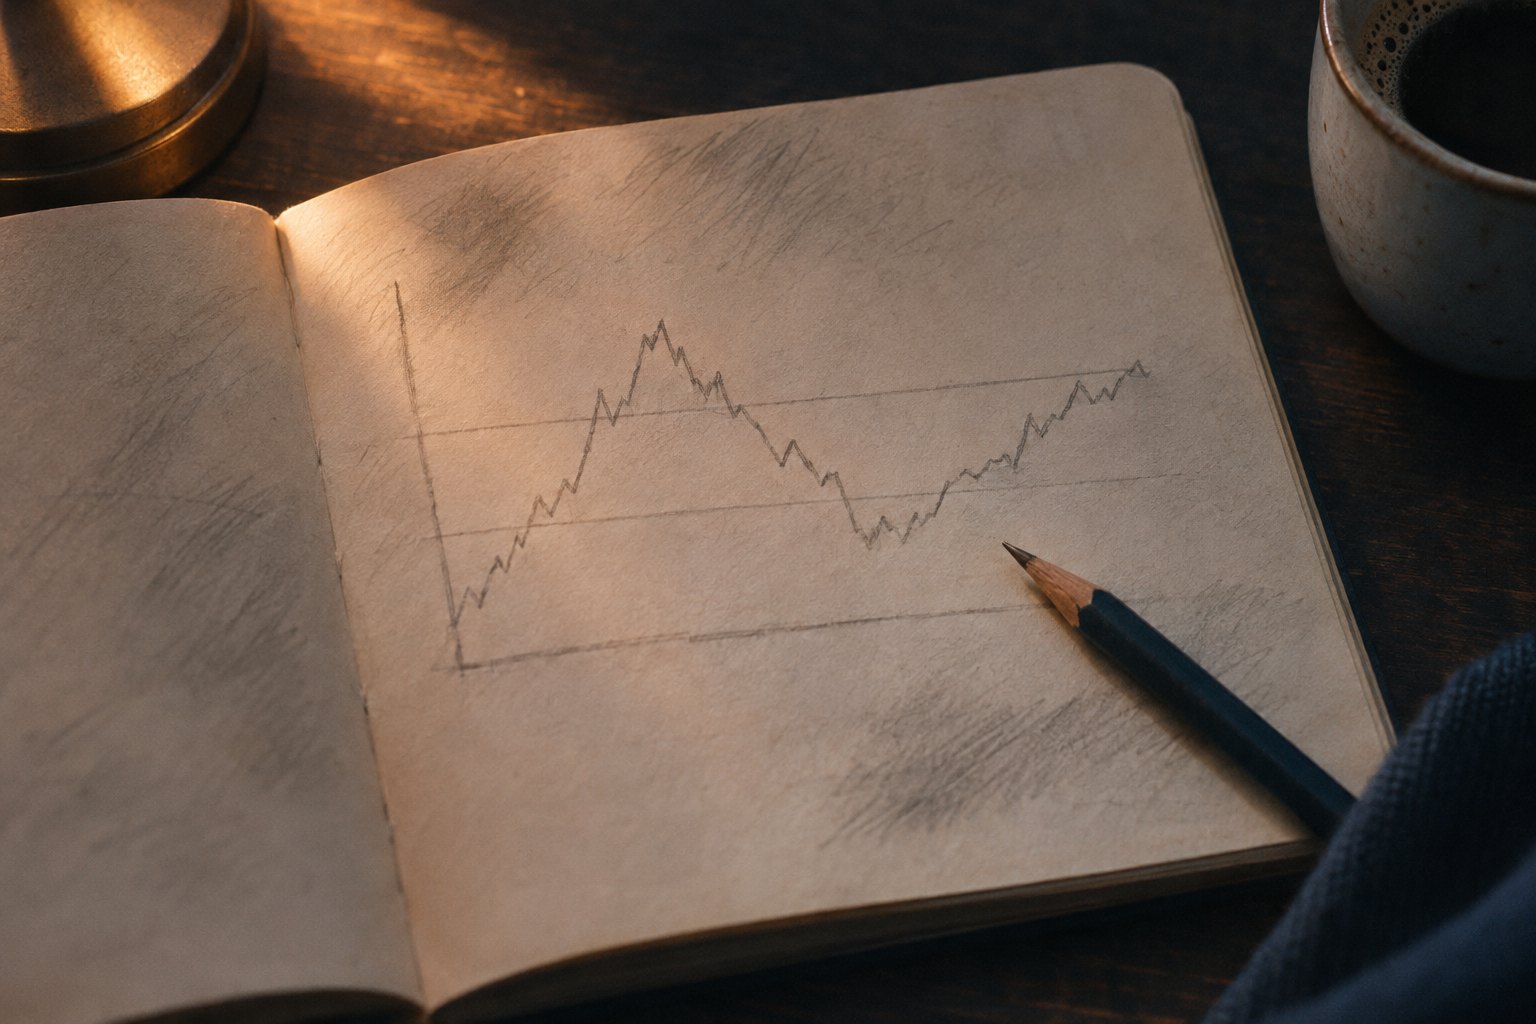
A screener can find an interesting price. It cannot decide where the idea is wrong. That number gets drawn on the printed chart, argued about, and only then typed into the morning message.

It is the slowest part of the process and the only part that matters. If a name has no clean place to be wrong, it does not make the list — no matter how good the story is.

An open notebook with a hand-drawn chart sketch and two pencil level lines
Two lines drawn across the chart: where we enter, where we admit we're wrong.

The arithmetic

Why the ratio matters more than the pick

Using the illustrative figures above: entry 115.77, target 122.95, stop 112.53.

3.24Risk per share
(entry − stop)
7.18Reward per share
(target − entry)
2.2 : 1Reward-to-risk
2.8%Risk as % of entry

What that means in practice

At a 2.2-to-1 ratio you can be wrong more often than you're right and still break even or better — provided you actually take the stop. That proviso is doing almost all of the work. Most of the damage retail investors do to themselves happens by moving a stop down to "give it room", not by picking the wrong stock.

What would make this wrong

The idea fails if price closes below 112.53. It also fails if it gaps straight through the entry and never fills — in which case there's no trade, and a good alert says so instead of chasing. And it fails if the reason you bought disappears: the result is pulled, the sector reverses, the announcement is a dud.

Important. This is a worked example of the alert format, not a recommendation, not a historical trade, and not evidence that the method works. The tickers are real ASX companies because that's what the list covers; the prices and levels are invented for illustration.

Send me the next three on WhatsApp

Three ASX names, three levels, before the market opens. Free, no card, reply STOP to leave.

No cardNo subscriptionLeave anytime